Zooming and panning

Zooming and panning |
|
The simplest way to pan the x or y axis is to click on one of the axis tick labels (actually anywhere outside the plot area will work) and drag it until the part of the display you wish to view is visible. Sometimes you may want to pan both the x and y axes at the same time. Instead of doing separate pans on each axis you can do both at the same time by clicking anywhere in the plot area (but NOT on any of the traces) and dragging that point until the desired view is achieved.
Try the same thing as with panning, except drag with the right mouse button instead of the left. You will find that dragging towards the origin compresses the axis (for zooming out) and dragging away from the origin expands the axis (for zooming in). As with panning you can zoom both axes at once by a right click and drag in the plot area. (Unlike panning you don't have to worry about whether you are on a trace or not. The same thing will happen in either case.)
Often to get the desired view requires two mouse movements. The first, with a right click and drag to expand or contract the axis (or axes) and the second, with a left click, to re-center the display. You may find that this is the most convenient method, or perhaps you will like one of the other methods described below.
If the portion of the graph that you want to zoom in on is completely visible
on the graph, the fastest way of displaying the desired area is to draw an
expansion box. To do this, position the mouse in the plot area over one corner
of the area you wish to zoom in on. Then double click the mouse, but don't
release the mouse button after the second click. Hold the mouse button down
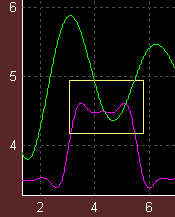
while dragging the mouse towards the opposite corner of the desired zoom area. A
yellow box will be drawn, which will be stretched or contracted as you drag the
mouse around. When you let go of the mouse button, the display will look similar
to the picture to the left. If you are happy with the expansion box you have
drawn, left click the mouse anywhere in the plot area (or even outside the plot
area if you avoid the edit boxes) and the display will expand to show only the
data inside the expansion box. If you are not happy with the expansion box,
right click anywhere. The expansion box will disappear and you can try again.

The
most general way of setting the axis limits is to simply type them in. Although
this is perhaps the most painstaking method it is appropriate when
you wish to have an exact value for one or more of the limits. As an example,
suppose you want to change the x-axis limits. First click on the grey "x" label
in front of the x-cursor edit box. When you do that, the edit box doubles up -
i.e. you see two edit boxes as in the picture to the left. And instead of
containing cursor values, these two edit boxes will be set to the current lower
and upper x-axis limits. Highlight one of the numbers in either edit box (by
double clicking on it, or by a single click and drag) and type in a new number
to replace the old (or single click and use the usual editing keys - arrows,
delete, etc). Press Enter to accept the new number. Tab also accepts the new
number and then pops you into the opposite edit box allowing you to edit the
other limit. If the new limits you are typing are inside the current plot area,
you will see two vertical lines at the location of the new limits. Once you get
the limits entered, proceed as with the expansion box. That is - left click
anywhere to accept the new limits, or right click to keep the old limits. Of
course the same procedure works for the y-axis limits as well.
The above two methods are more similar than you may think, and you can combine them both. After an expansion box is drawn, both the x and y-cursor edit boxes double up and contain the limits of the expansion box. If you are not satisfied with the expansion box location you can edit any or all of these limits before accepting them via a left click.
Whenever you change the x or y axis limits by any of the above methods, the previous limits are stored in a expansion history list. You can cycle thru these stored limits by right clicking on the XY↔ tag in the menu box. (See "Menu box" below). This list is 4 elements deep, so after the fourth zoom or pan the oldest display limits fall off the bottom of the stack.
When the flight data window is first drawn, both axes are auto-scaled to show the entire data range. At any later time you can auto-scale the x-axis by right clicking on the grey "x" label in front of the x-cursor edit box. Right clicking on the grey "y" label is similar for auto-scaling the y-axis, although there is one difference. The difference is that the y-axis is scaled to insure that the data associated with the active trace is visible. There is a way to auto-scale so that all traces will be completely visible. Simply cycle thru the display expansion history. After the last stored display limits are used, one more click will auto-scale both axes. (Another click will then cycle thru the expansion history list again.)