Options box

Options box |
|
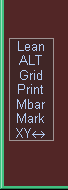
The options box contains 7 tags whose use is explained below:
Each click on the XY↔ (XYrotate) tag cycles the x and y axis limits to the next display expansion stored in a history list. (The axis limits from the last four zooms or pans are saved in this list). After all the display limits in the history list are used, the next click autoscales both axes so that all the data is displayed. The next click again uses the first display expansion in the history list.
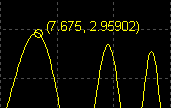
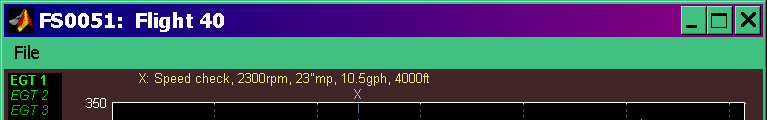
When you click on the Mark tag, a circular mark is placed at the current cursor location and a text string is added to the plot containing the x and y coordinates of the cursor location. The text string will be the same color as the active trace. If the text label is not positioned where you want it, click on the label and drag it to the desired location.
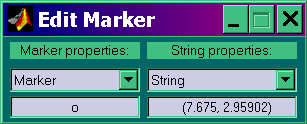
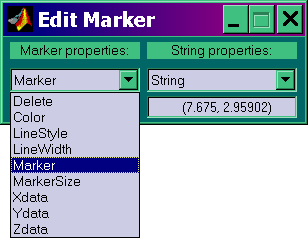
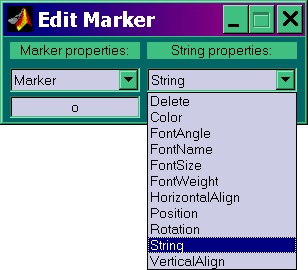
If you right click on the text label, a new dialog box will appear which allows you to change any or all of the properties of both the trace marker and the text string. The two pictures below show the Marker and String properties respectively that you can edit. Note that both the Marker and the String popups have delete as one of the options. This is useful if you want to put a marker without a string or a string without a marker. You may delete all the markers you have added this way by selecting delete and then typing all into the edit box below the popup. The same trick works for deleting all the strings added to the figure via the Mark tag. Note that you can have many of these Edit Marker dialog boxes open at same time - as many as one per text string (or even more, although there is probably little benefit to that). All these dialog boxes will be deleted automatically if the flight data window is deleted. To see an example of how you might use this feature to annotate your flight data graphs, click here.
 |
 |
Clicking on Mbar enables a standard Windows menu bar to appear in the flight data window, however the only menu contained on it (for now) is the File menu. Clicking on the file menu gives you this pop down menu:
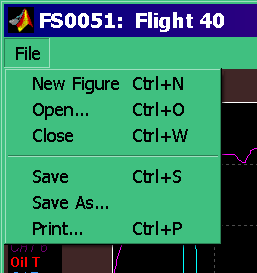 The
Print selection is similar to using the Hardcopy tag
above with the Windows device selection. The Save and
Save As selections save the flight data window as a
.fig file which is an object style description of the figure (as opposed to the
bit-mapped description generated by the Hardcopy dialog box described below). A description of this
file format and utilities to make use of it will be provided in a future
release.
The
Print selection is similar to using the Hardcopy tag
above with the Windows device selection. The Save and
Save As selections save the flight data window as a
.fig file which is an object style description of the figure (as opposed to the
bit-mapped description generated by the Hardcopy dialog box described below). A description of this
file format and utilities to make use of it will be provided in a future
release.
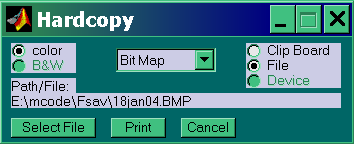 This
tag can greatly simplify the task of printing the flight data window or
capturing it for inclusion in reports. When you click on this tag the new window
shown at the right appears. Click on the popup in the center of this window to
select the desired graphics output. The choices are shown below:
This
tag can greatly simplify the task of printing the flight data window or
capturing it for inclusion in reports. When you click on this tag the new window
shown at the right appears. Click on the popup in the center of this window to
select the desired graphics output. The choices are shown below:
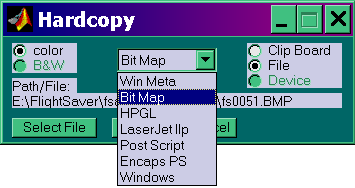 All the selections are vector formats except Bit Map, which produces a windows
.BMP file. For all the graphics formats except for Bit Map and
LaserJet you will
have a choice of color or black and white (see the selection on the upper
left side). Bit Maps are always color and LaserJet (HP printer control language)
output is always black and white. On the right side you select where you want
the graphics output to go. Windows Meta files and Bit Maps may be sent to the
clipboard or to a file. HPGL (HP graphics language), Postscript and Encapsulated
Postscript output must always be sent to a file. The LaserJet (HPCL) output may
go to a file or to a device, and the Windows output (which uses the windows
printer drivers) is device only. When you click on the Device radio button the
Select File button (lower left) changes to a
Select Device button, which
when clicked brings up the standard Windows printer setup dialog box. When you
click on the File radio button, the Select Dev button changes back to a
Select File button, which when clicked brings up a standard windows file
selection box. Whatever file you select from that dialog box will then appear in
the middle of the hardcopy window (after Path/File). Then just click on
Print and the selected output format will be sent to the selected destination.
All the selections are vector formats except Bit Map, which produces a windows
.BMP file. For all the graphics formats except for Bit Map and
LaserJet you will
have a choice of color or black and white (see the selection on the upper
left side). Bit Maps are always color and LaserJet (HP printer control language)
output is always black and white. On the right side you select where you want
the graphics output to go. Windows Meta files and Bit Maps may be sent to the
clipboard or to a file. HPGL (HP graphics language), Postscript and Encapsulated
Postscript output must always be sent to a file. The LaserJet (HPCL) output may
go to a file or to a device, and the Windows output (which uses the windows
printer drivers) is device only. When you click on the Device radio button the
Select File button (lower left) changes to a
Select Device button, which
when clicked brings up the standard Windows printer setup dialog box. When you
click on the File radio button, the Select Dev button changes back to a
Select File button, which when clicked brings up a standard windows file
selection box. Whatever file you select from that dialog box will then appear in
the middle of the hardcopy window (after Path/File). Then just click on
Print and the selected output format will be sent to the selected destination.
Clicking on this tag removes the dashed grid lines from the display window and instead places small tick marks on both axes at the same coordinates as the grid lines that were removed. Occasionally this can help unclutter the display. Clicking on Grid again restores the grid lines.
Clicking on this tag selects the “alternate data set” for display. If you have a twin-engine plane, the first 12 traces showing the EGTs and CHTs switch from showing the right engine data to the left engine data. The normal fuel flow display (which is heavily smoothed to make the display easier to read) is switched to show the raw unfiltered data, and the tag changes from Fuel to FuelR to indicate this change. Similarly for the heavily filtered ground speed data, and its tag changes from GS to GSraw. Clicking on the ALT tag a second time returns the flight display to showing the primary data set.
Clicking on this creates a leaning chart similar to the one shown here. To get a meaningful chart you must first expand the display so that the x-axis includes a time period surrounding a single peak in the EGTs caused by a slow reduction in fuel flow. If the leaning chart doesn’t include the fuel flow range you desire, it's easy to drag the traces (first with the left button and then with the right) until the data range is correct, and then click on the Lean tag again.