Cursoring

Cursoring |
|
 Simply
click on the trace you wish to cursor. The cursor will move to the trace you
clicked on and that trace will become active. The x and y-cursor edit boxes will
change to the color of the new active trace and those edit boxes will be updated
to contain the current x and y locations of the cursor. Although the color of
the edit box will often be enough to let you know which trace is active it
sometimes may be difficult to tell at a glance if there are many traces plotted.
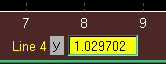
For this reason a cursor ID tag is displayed just to the left of the y-cursor
edit box. This cursor ID tag is also in the same
color as the active trace. (Note: The cursor ID tag won't actually be
Line 4
as in this picture; this is just a generic example. It will contain the actual
trace name, such as CHT5, OilT,
P.ALT, etc.)
Simply
click on the trace you wish to cursor. The cursor will move to the trace you
clicked on and that trace will become active. The x and y-cursor edit boxes will
change to the color of the new active trace and those edit boxes will be updated
to contain the current x and y locations of the cursor. Although the color of
the edit box will often be enough to let you know which trace is active it
sometimes may be difficult to tell at a glance if there are many traces plotted.
For this reason a cursor ID tag is displayed just to the left of the y-cursor
edit box. This cursor ID tag is also in the same
color as the active trace. (Note: The cursor ID tag won't actually be
Line 4
as in this picture; this is just a generic example. It will contain the actual
trace name, such as CHT5, OilT,
P.ALT, etc.)
Click on a trace, hold down the mouse button and drag the cursor left or right. The cursor will follow the mouse as you are dragging and the edit boxes will continually update with the current cursor location. Make sure you click directly on the trace. If you are not close enough to the trace, when you drag the mouse the x and y axis limits will pan to follow the mouse movement.
If you type a new value into the x-cursor edit box, the cursor will move to (x,y) where x is the value you typed in, and y is the value of the active trace at location x. (i.e. the cursor will remain on the active trace). However if you type a new value into the y-cursor edit box, the cursor will move up or down (off the trace) to the location (x,y) where x is the old cursor x position, and y is the value you typed in.
![]() In
the lower left corner of the display you will find the cursor peak/valley
buttons (up and down arrows) as well as the delta cursor button. When you click
on the up arrow (peak finder), the cursor will move to the largest peak in the
current display range of the active trace. The next click on the up arrow will move
the cursor to the second largest peak and so on. Any cursor movement
other than a peak/valley button will reset the peak finder so that the next time
you click on the up arrow the cursor again moves to the largest peak in the
display range. The valley button works the same as the peak button except the
cursor moves to successive local minima.
In
the lower left corner of the display you will find the cursor peak/valley
buttons (up and down arrows) as well as the delta cursor button. When you click
on the up arrow (peak finder), the cursor will move to the largest peak in the
current display range of the active trace. The next click on the up arrow will move
the cursor to the second largest peak and so on. Any cursor movement
other than a peak/valley button will reset the peak finder so that the next time
you click on the up arrow the cursor again moves to the largest peak in the
display range. The valley button works the same as the peak button except the
cursor moves to successive local minima.
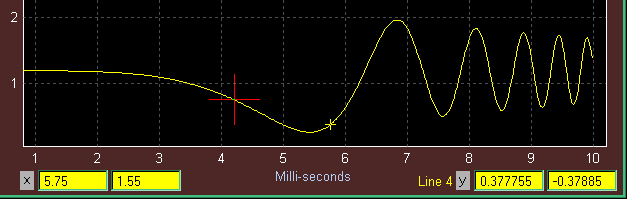
Delta cursors are useful for measuring horizontal or vertical distances between two points on a trace. First move the cursor to the desired reference point on the trace. Then press the Delta (∆) cursor button. The reference location will be marked with a large red plus (about 4 times bigger than the normal cursor). Then click on a different point on the same trace (or drag the cursor to the desired location). The view will then look similar to the picture shown here. You can read the current location of the cursor (the small yellow plus) in the usual way - i.e. the edit boxes just to the right of the grey x/y labels. In this case the cursor x location is 5.75 msec and the y location is 0.377755. The other two edit boxes show how far away the cursor is from the marked reference. In this example, it shows that the cursor at a location 1.55 msec later than and .37885 units less than the marked reference. Simply click on the delta cursor button again, and the reference mark will disappear and the usual cursor operation will return.
|
|
||||||
|
|
 |
 |
 |
|||
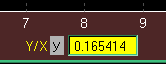
When you click on the cursor ID tag (Line 4 in this example) the ID tag changes to Y/X and the value in the y-cursor edit box changes to show the ratio of the y and x cursor values at the current cursor position (i.e. the slope of the line from the origin to the cursor). If delta cursors were enabled, an additional edit box appears to the right of the y-cursor edit box. This additional box contains ΔY/ΔX, which is the slope of the line connecting the marked position to the current cursor. You can use this to estimate the slope of a trace at a particular point.
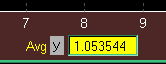
When you click on the ID tag a second time, the Y/X changes to Avg and the edit box then shows the average y-value of all the points of the active trace that are within the current display x limits.
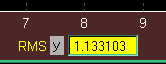
When you click on the ID tag a third time, the Avg changes to RMS and the edit box then shows the rms value of the active trace. As with Avg, the rms calculation only includes points that are within the currently displayed x-axis limits. (In case you are not familiar with this commonly used form of averaging - rms stands for "root mean square" and is calculated by taking the square root of the average of the squares of the data values).
Clicking the ID tag a fourth time (or clicking in the plot area) restores the cursor readout to show the usual Y value and the ID tag again shows the name of the cursored trace.