Note that the flight data window can be minimized, maximized, stretched,
shrunk, and moved around using the customary Windows controls. However, if you
shrink the window much smaller than the default size, some of the graphic
elements may start to overlap. When you close a
flight data window, Fsaver remembers its size and location so that the next
flight data window can start out with the same size and location as before.
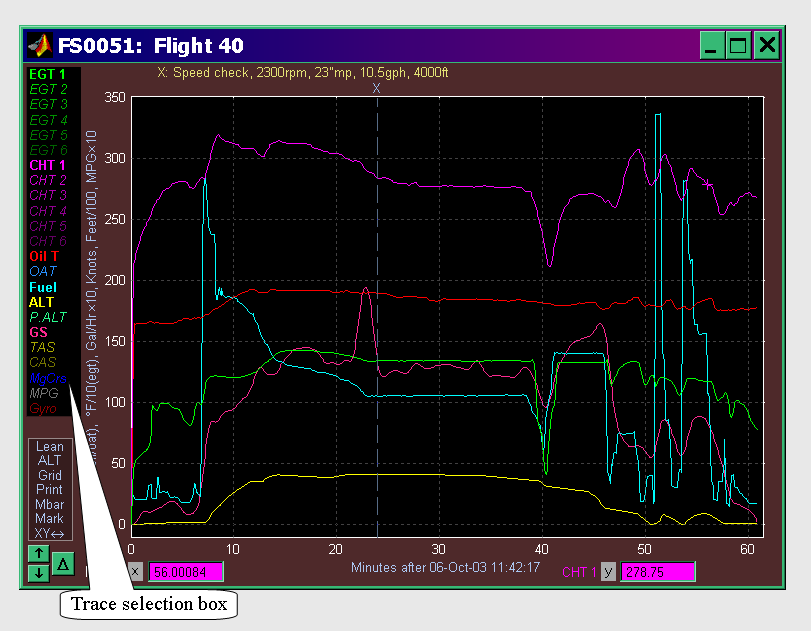
The trace selection box identifies the plotted traces by color and also tells
you which traces are enabled. The enabled traces are shown in bold and the
disabled traces are shown in italics. In the flight data window shown
above only six of the twenty traces are enabled. As you will see later, this is
easy to change.
| Fuel |
The instantaneous fuel flow in gallons/hour
times 10. Since the graph uses a single y-axis scale (which is optimized for
the CHT display), the "times 10" allows the fuel flow to fit
comfortably into the graph. Because the data from the fuel flow sensor is a
bit noisy, the data is smoothed for a more readable display. If you want to
see the data before the smoothing, click on the "ALT" tag. The trace ID will
change to "FuelR" so that you know you are viewing the raw data.
|
| CAS |
Calibrated airspeed (in knots) from the
FlightSaver's pitot pressure transducer
|
| TAS |
True airspeed (in knots). This is CAS corrected
by the pressure altitude and the outside air temperature.
|
| P.ALT |
Pressure altitude (in feet/100) from the
FlightSaver's static pressure transducer
|
| ALT |
True altitude (in feet/100) from the GPS data
|
| GS |
Ground speed (in knots), from the GPS data. The
raw ground speed data is quite noisy, so it is heavily filtered for the
display. Click on the "ALT" tag to view the data before smoothing. (The
trace ID will change to "GSraw").
|
| MPG |
Miles per Gallon (nautical) times 10. This is
computed from TAS and so is a measure of efficiency. (It is not affected by
the winds). Your actual MPG relative to the ground
will be lower than the plotted value when flying into a headwind.
|
| MgCrs |
Magnetic course (in degrees) - from GPS data
|
| CHT1-CHT6 |
Cylinder head temperature (in degrees F). For 4
cylinder engines the last two are not shown. For twins this is the right
engine. To display the data for the left engine, click on the "ALT" tag. The
trace IDs switch to lower case (cht6) when viewing the data for the left
engine. (Think "l" for "left" and "lower case").
|
| EGT1-EGT6 |
Exhaust gas temperature (in degrees F divided by
10). For twins, to display the data for the left engine, click on the "ALT"
tag. The trace IDs switch to lower case when viewing the data for the left
engine.
|
| OilT, OAT, MP, RPM, TIT, Gyro |
The 3 remaining traces may display miscellaneous data from the engine
analyzer. Which traces are displayed depend on your setup and which extra
sensors (if any) have been installed with your engine analyzer. In the plot
above, the 3 traces shown are Oil Temperature, Outside Air Temperature, and
Gyro Vacuum. If sensors were also installed for Manifold Pressure, RPM, and
Turbine-Inlet Temperature, then you could view three traces by pressing the
"ALT" tag, at which point the original three traces will disappear. Pressing
"ALT" again restores the original view. Of course the trace labels change to
indicate the data that is actually plotted.
|
 Flight data window